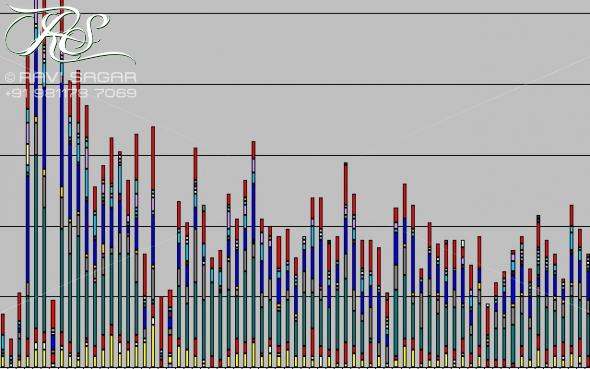
Every week I prepare one report in Excel with lot of graphs. The data in the excel sheet is added in every report and the graphs that are generated based on that data are of course also updated. The client was satisfied with the report but asked me to preserve the color of the various countries that appear on the stacked bar chart. Initially for couple of weeks I didn't really paid much attention but then the client got little demanding and requested me again in harsh tone to do it. I still use Excel 2003 and not sure whether this feature is there in 2007 version, I guess not. After searching on the internet I did found a solution that requires creation of a macro that can be used to hard code the values and assign them specific color.
Here is the code. I hope it will be helpful to you. Enjoy.
-
Sub change_bar_color()
-
-
-
NumPoints = ActiveChart.SeriesCollection.Count
-
-
For x = 1 To NumPoints
-
-
thispt = ActiveChart.SeriesCollection(x).Name
-
-
Select Case thispt
-
Case "India"
-
ActiveChart.SeriesCollection(x).Interior.ColorIndex = 2
-
Case "USA"
-
ActiveChart.SeriesCollection(x).Interior.ColorIndex = 14
-
Case "Africa"
-
ActiveChart.SeriesCollection(x).Interior.ColorIndex = 44
-
Case "Australia"
-
ActiveChart.SeriesCollection(x).Interior.ColorIndex = 5
-
Case "Other"
-
ActiveChart.SeriesCollection(x).Interior.ColorIndex = 21
-
-
Case Else
-
' Add code here to handle an unexpected label
-
End Select
-
-
Next x
-
-
-
End Sub
Of course you need to modify the above code as per your needs. Though I am a hard core linux user but for few things I still use windows xp and Excel is one tool that I believe is one of the best and most powerful tool built by Microsoft. Lot of amazing things can be done in Excel and its power can be extended with the help of VBA to create applications and automating.